Data Visualisation
13 May 2020
@maartenzam
Boehringer Ingelheim
3.Going beyond bars and lines
Today
1. Data visualisation fundamentals
2. Online and interactive data visualisation
3. Going beyond bars and lines: non-standard visualisations
4. Dashboard design
Going beyond bars and lines
Creative with dots
Creative with bars
Creative with time
Hierarchies
Multidimensional data
Exercise: RAWGraphs
Creative with dots

Dot plot
Alternative to grouped bar chart

Dot plot
Data density can be high


Creative with bars

Bullet chart
To show progress or status

Bullet chart

Marimekko
Show shares across 2 dimensions
The worlds population has grown, and the regional distribution of poverty has changed
Creative with time
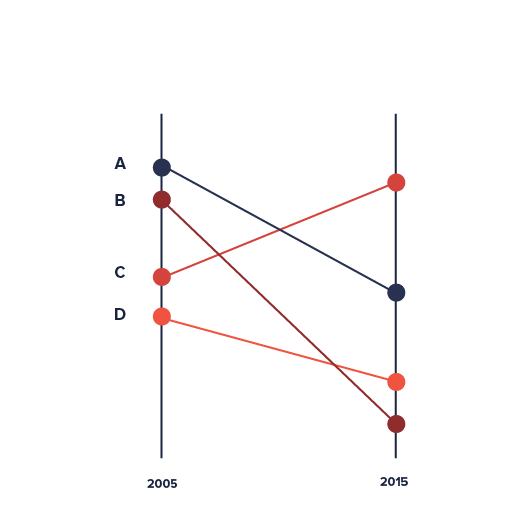
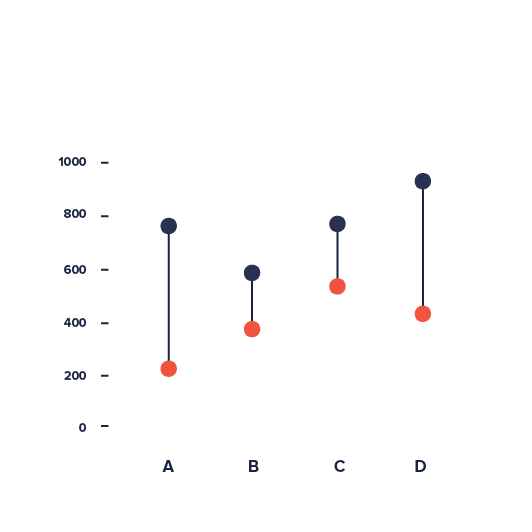
Slope chart
Compare 2 moments in time

Slope chart
Compare 2 moments in time

Slope chart
Compare 2 moments in time

Horizon chart
Data dense time series

Horizon chart
Data dense time series

Horizon chart
Data dense time series

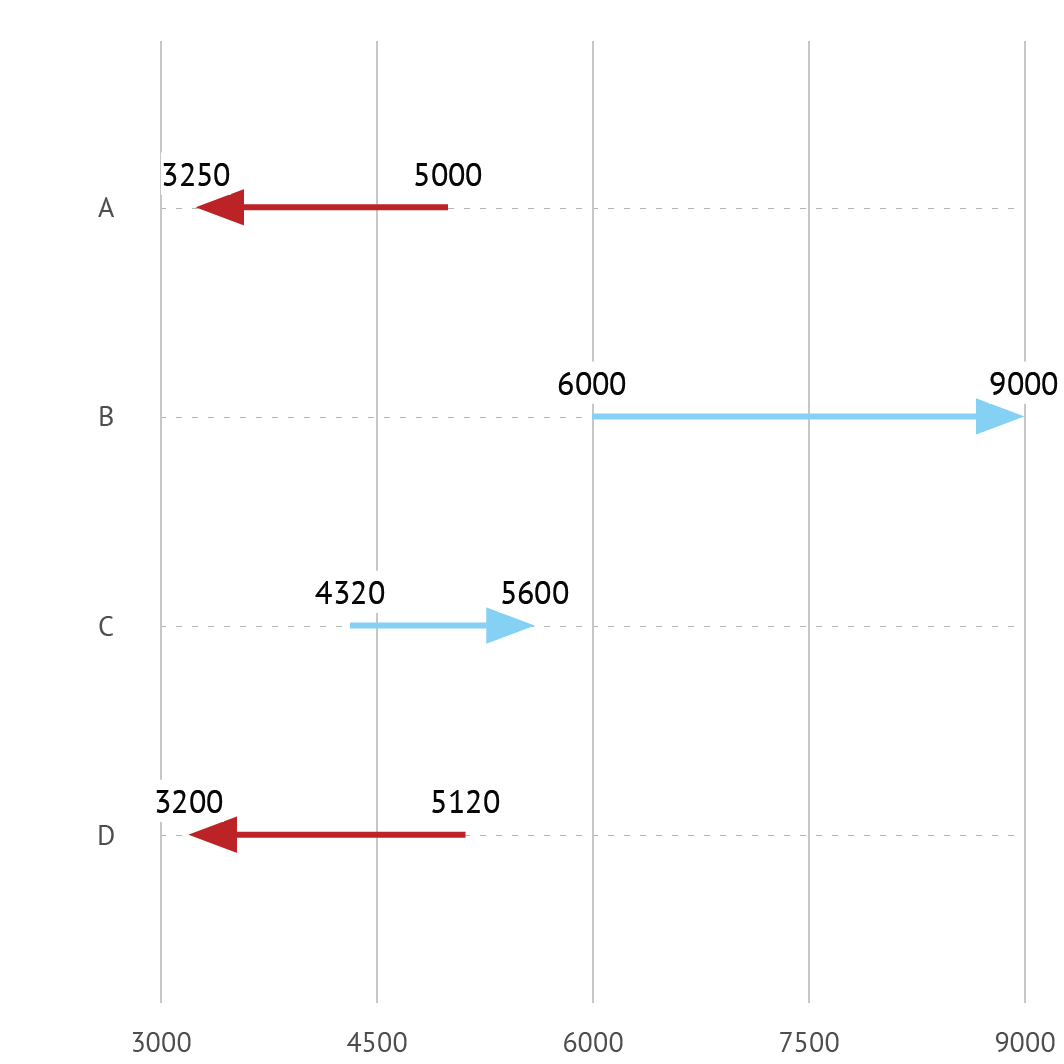
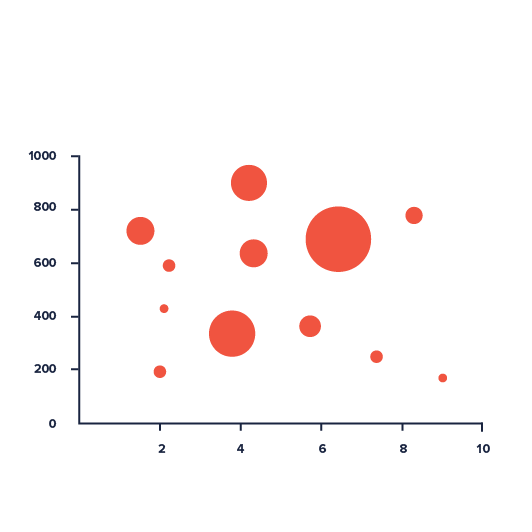
Connected scatter plot
Trends in 2 dimensions over time

Connected scatter plot
Hierarchies

Waterfall chart
Cumulative effect of components


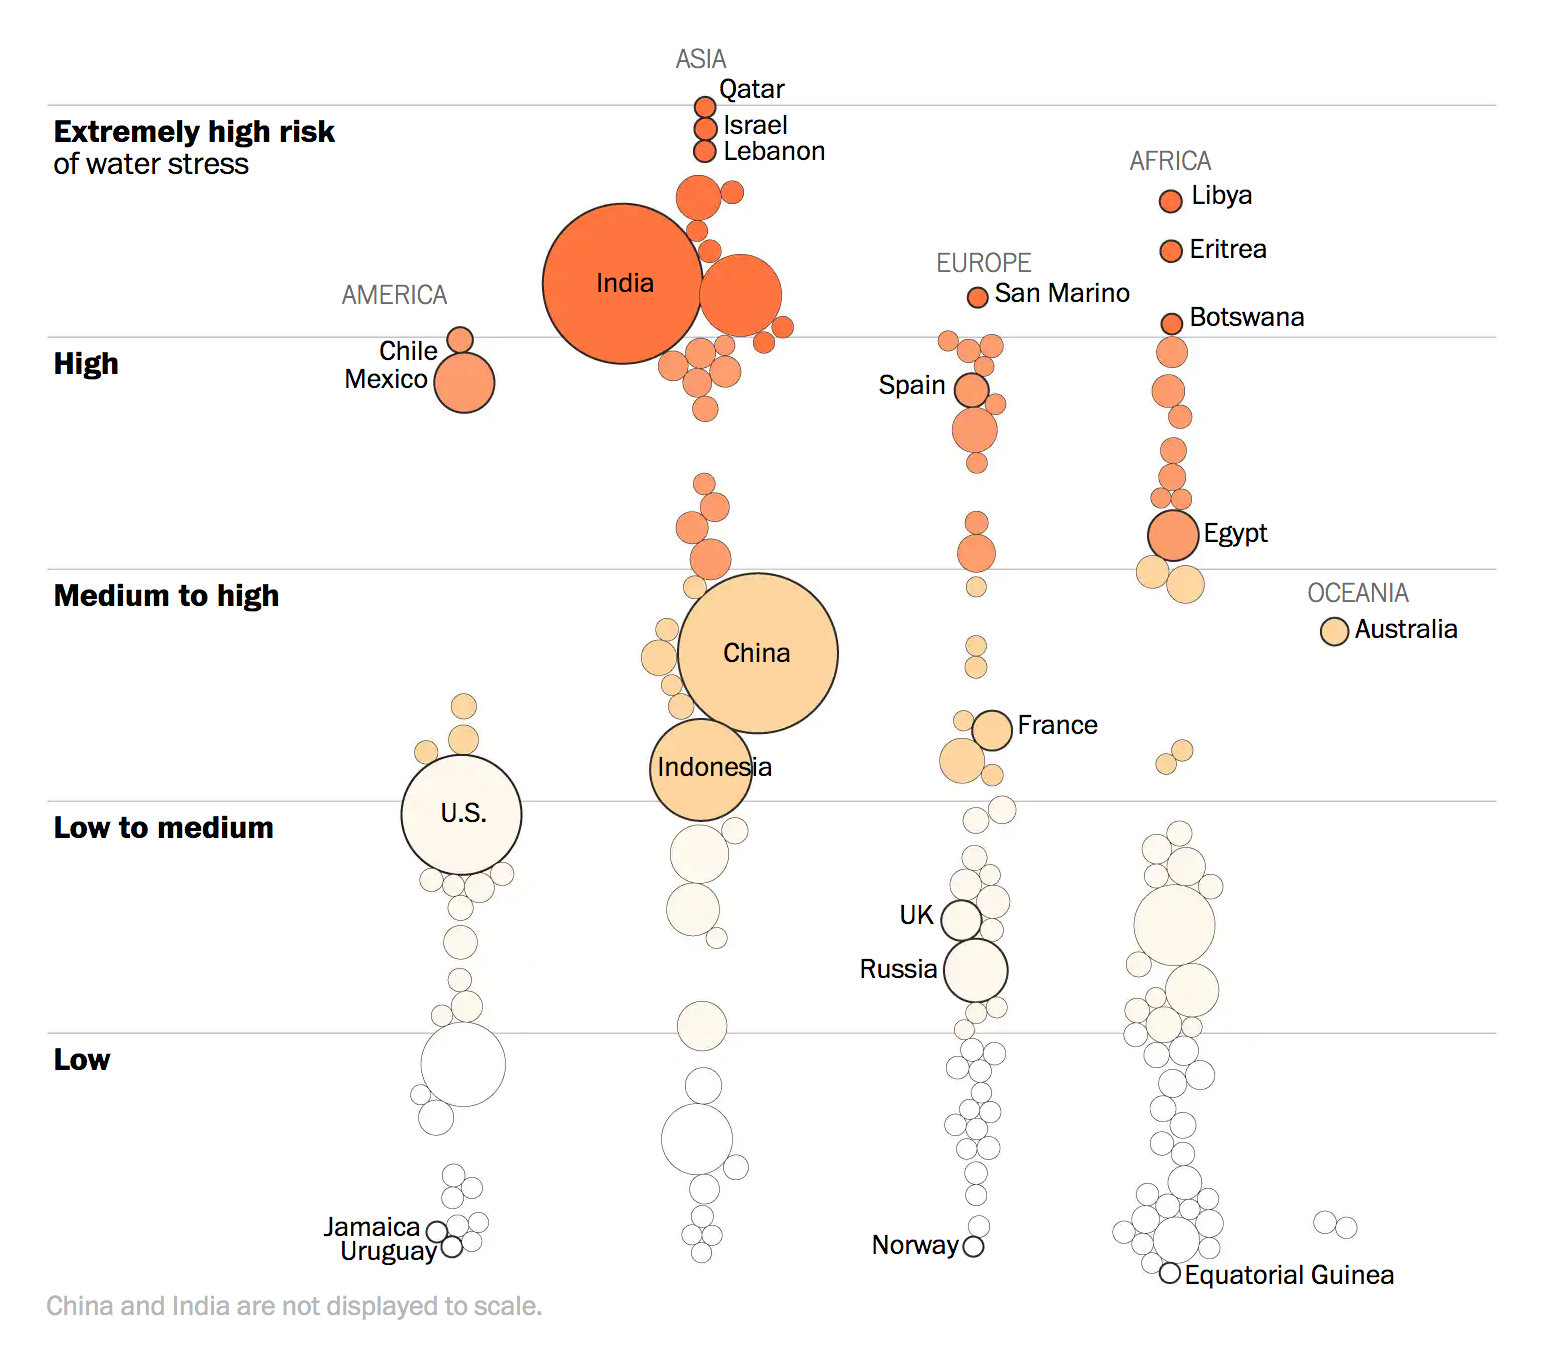
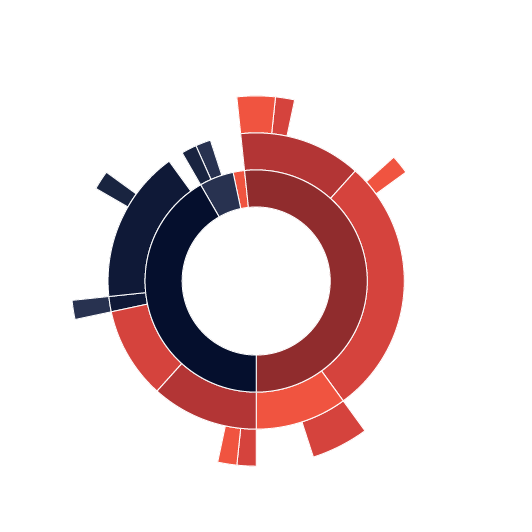
Treemap
Hierarchy with numerical dimension
Multidimensional data
Heatmap
2 categorical dimensions x 1 numerical


Parallel coordi-
nates
Multiple numerical (or ordinal) dimensions


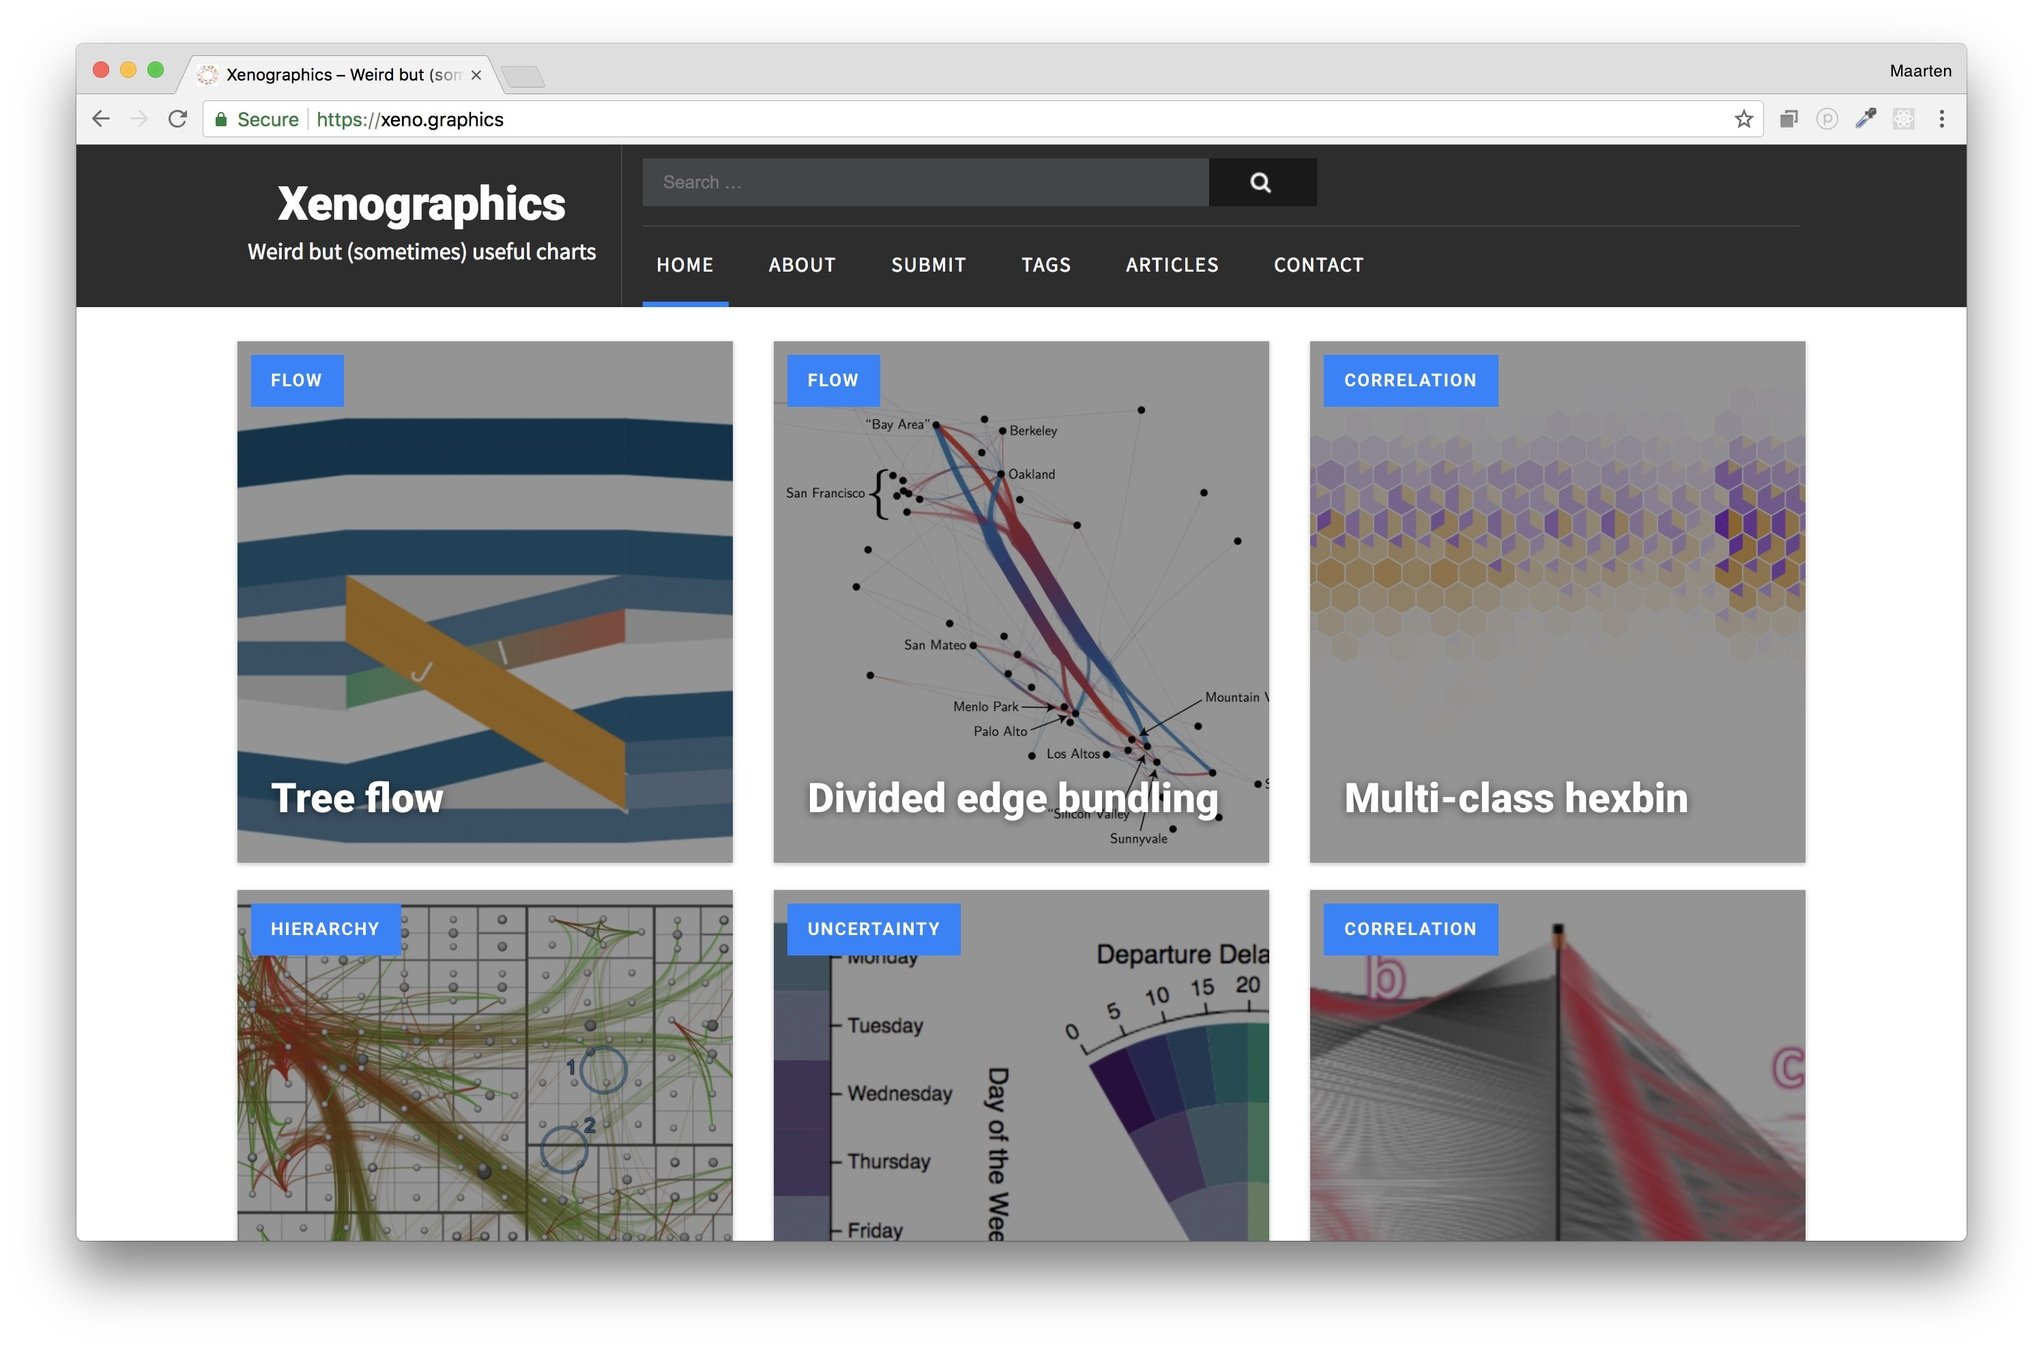
Exercise: RAWGraphs
rawgraphs.io
Play with the built in sample datasets
Follow one of the tutorials
Share what you made (if you want)
Tomorrow
1. Data visualisation fundamentals
2. Online and interactive data visualisation
3. Going beyond bars and lines: non-standard visualisations
4. Dashboard design