Simple Data Doodle
Scrape, Process, Pivot and Chart
(all while holding your breath)
Adi Eyal
@soapsudtycoon
Let's hunt for some data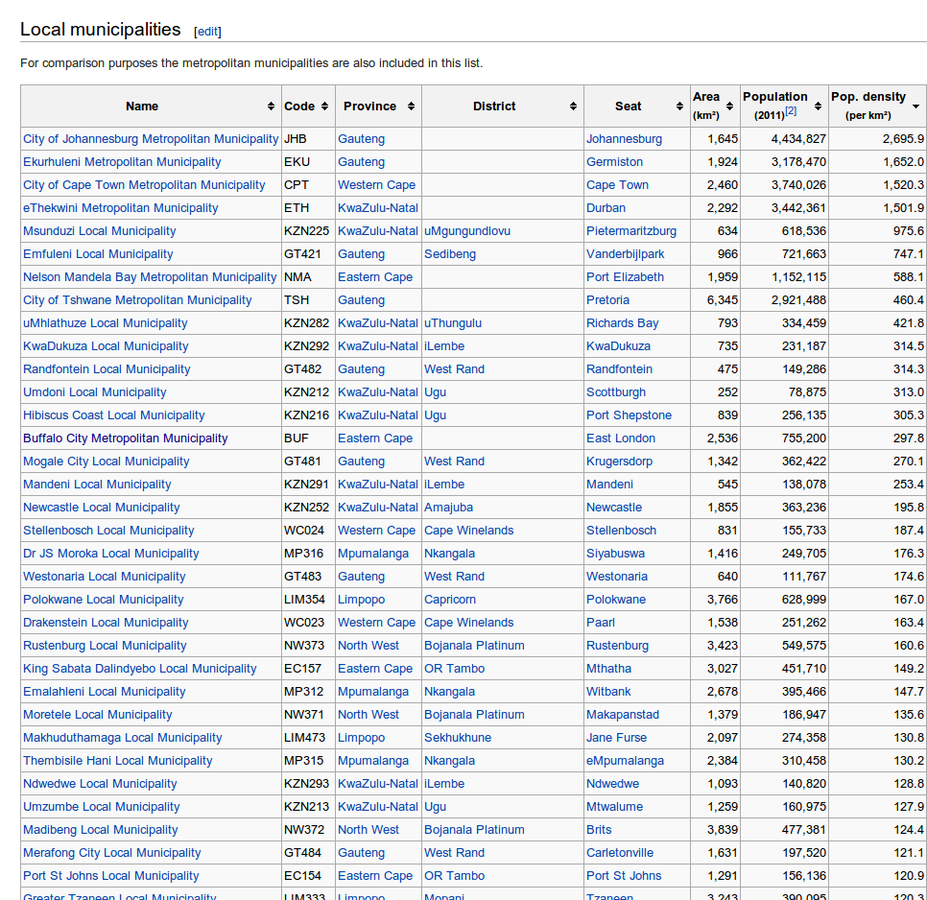
Whip open Google Docs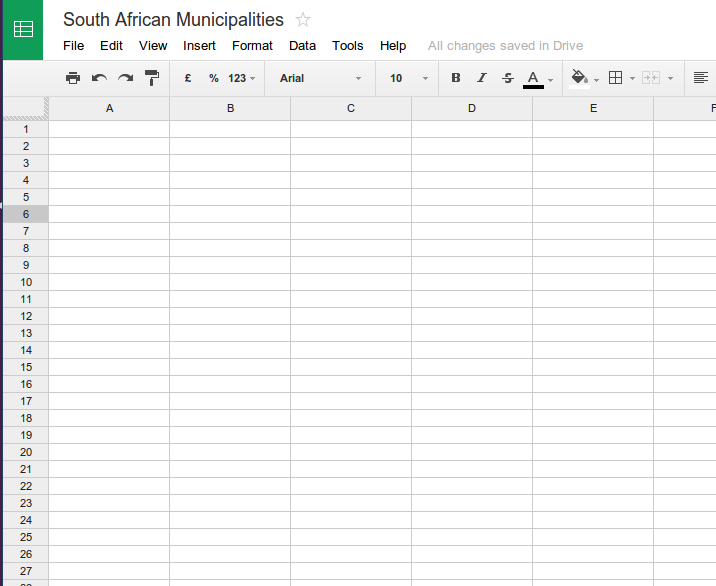
1, 2, 3 ... Scrape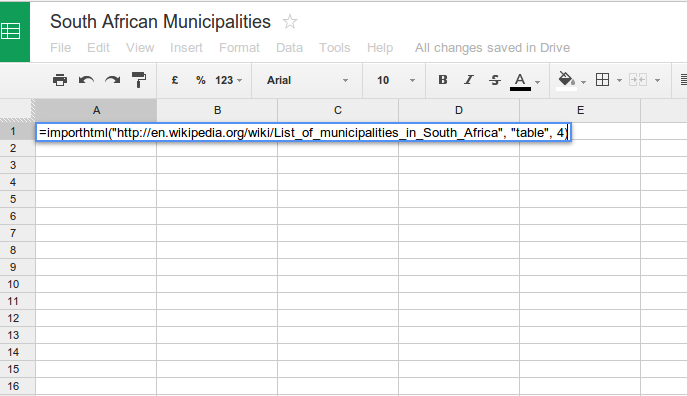
Doesn't it just make you breathless?
Create a working copy
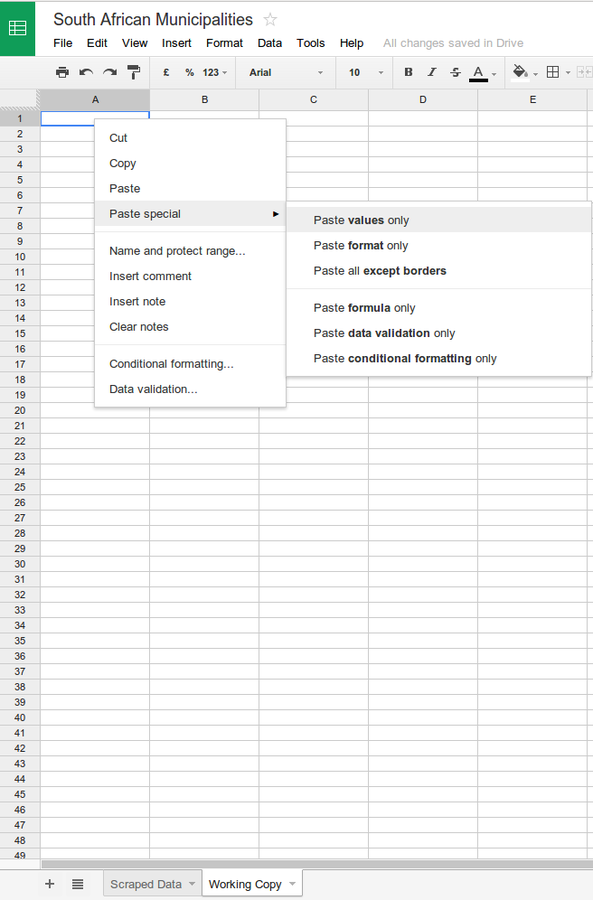
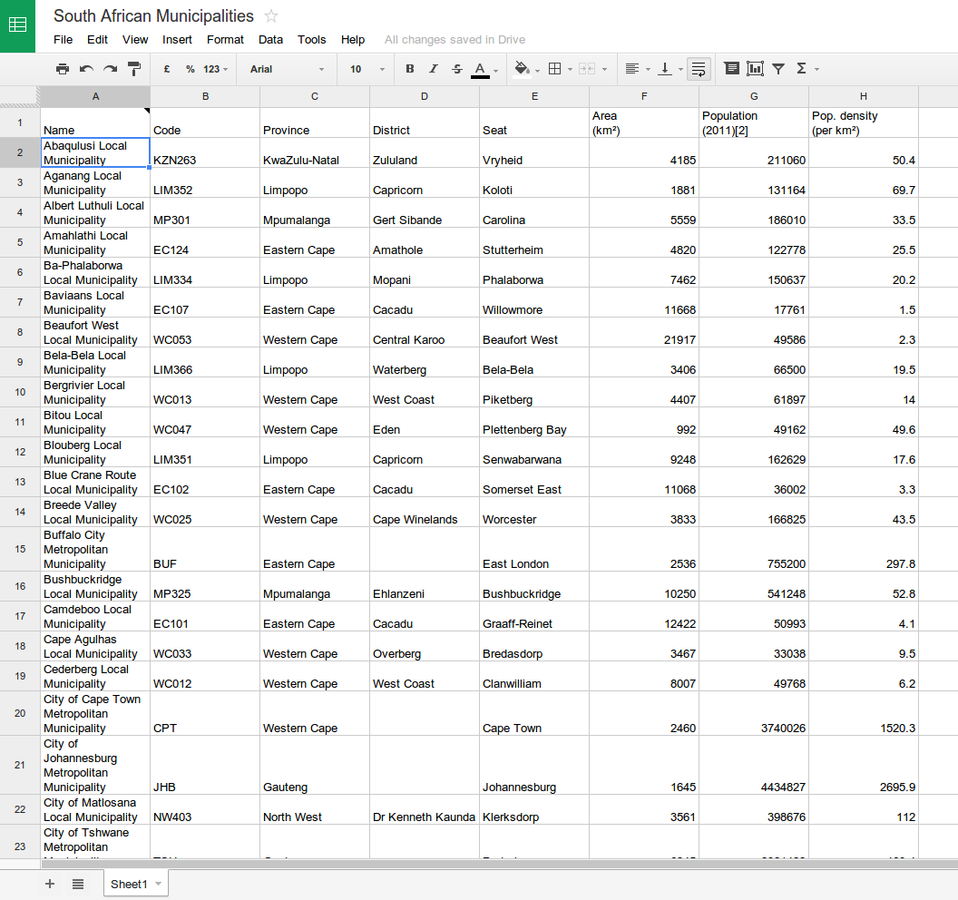
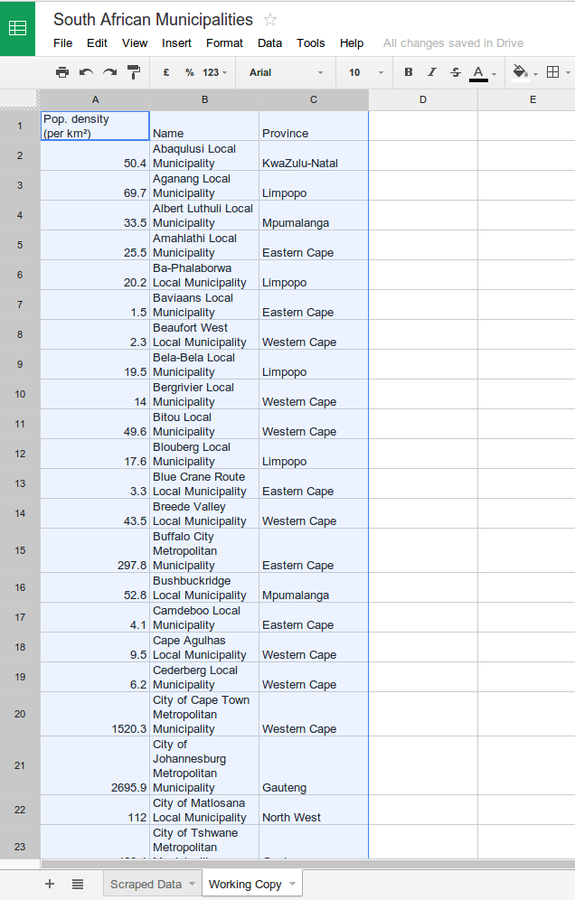
Paste
(also re-arrange the columns as shown - you'll need this later)
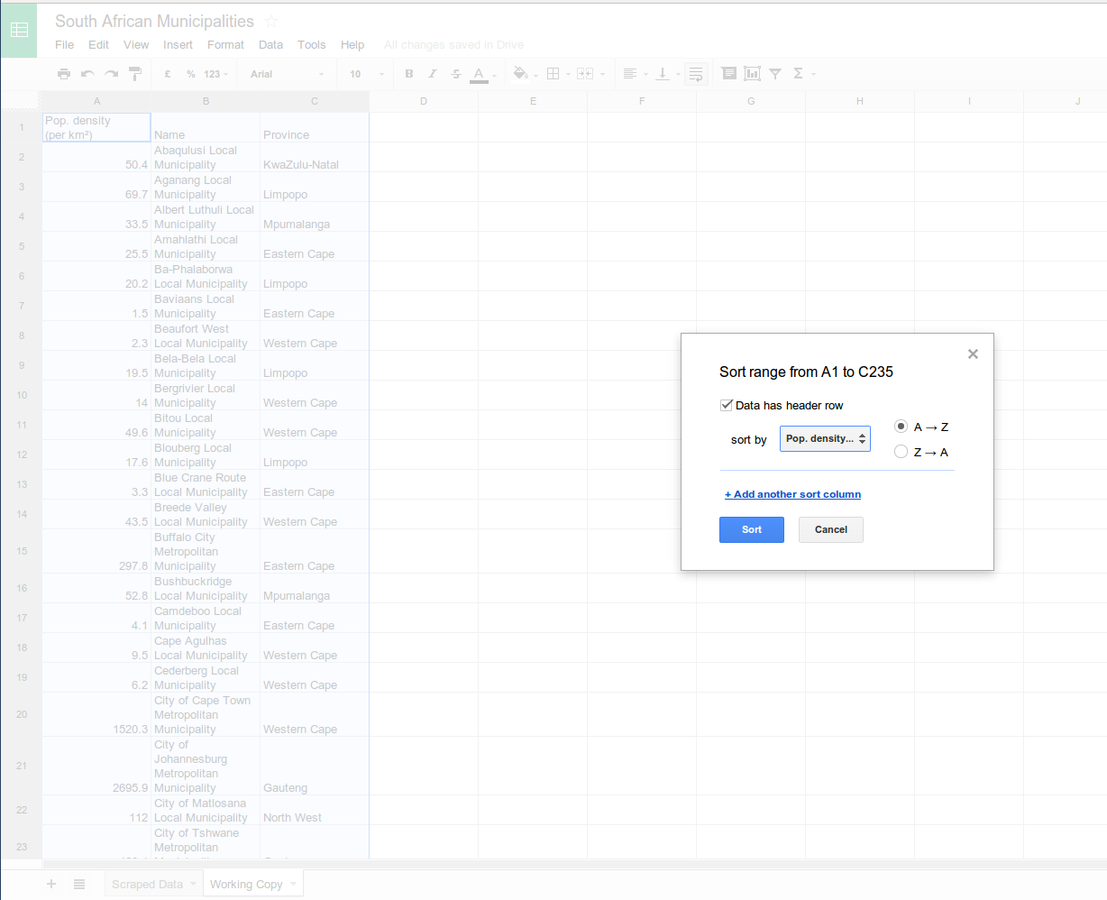
Sort by density
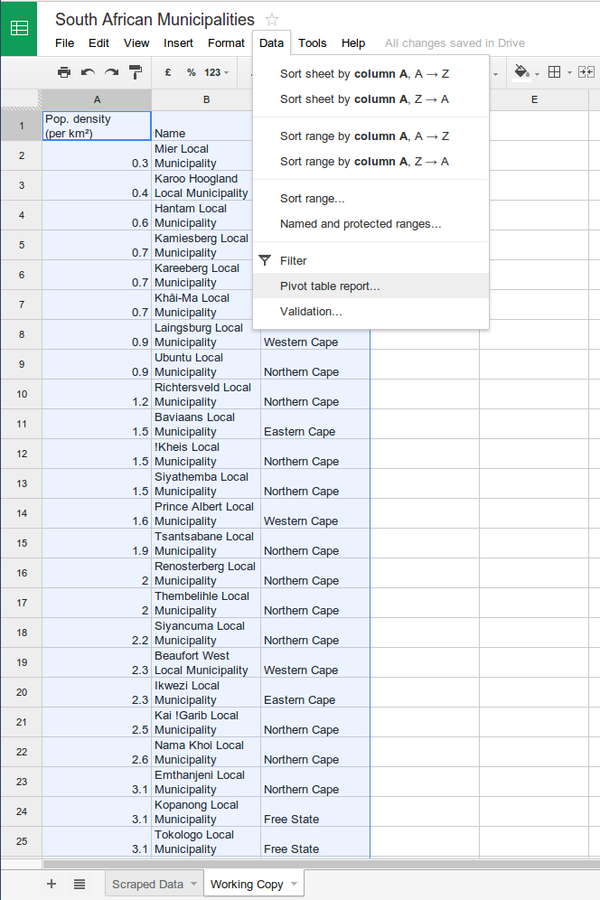
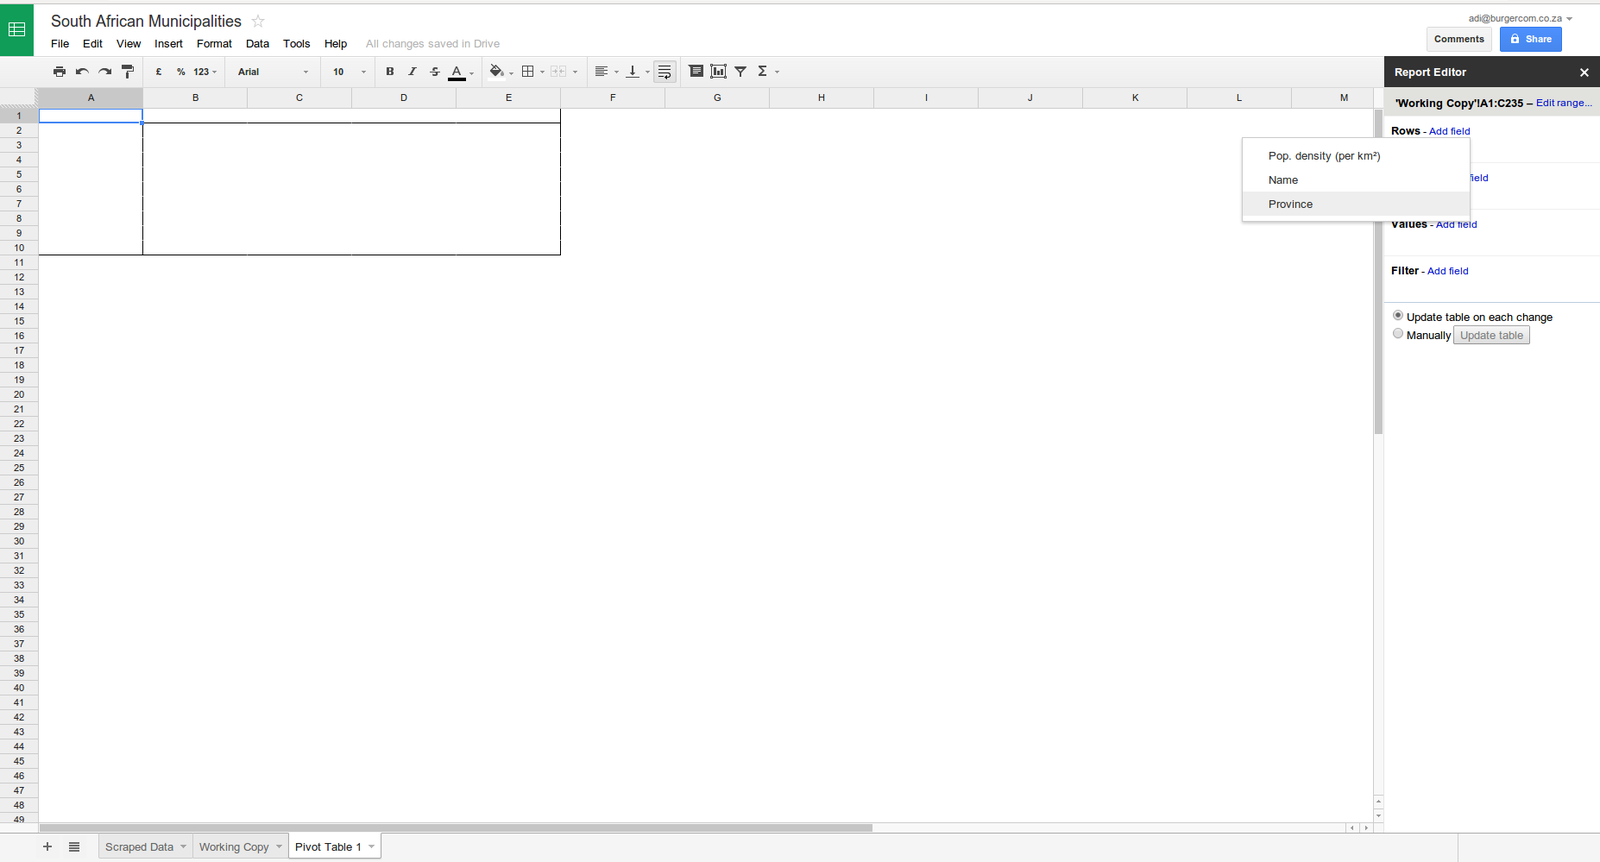
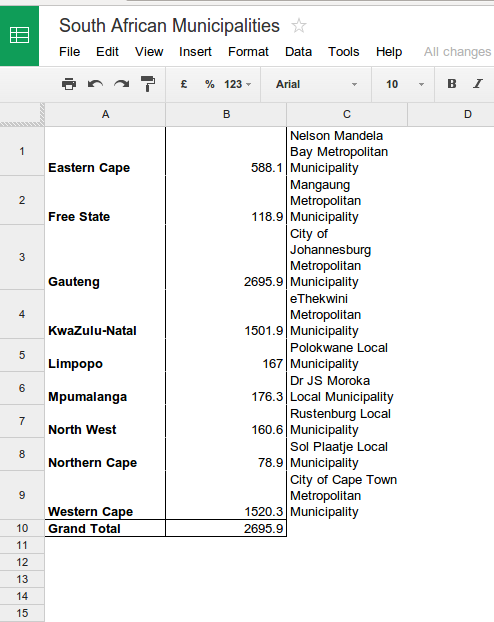
Now let's pivot
honestly not as scary as it sounds
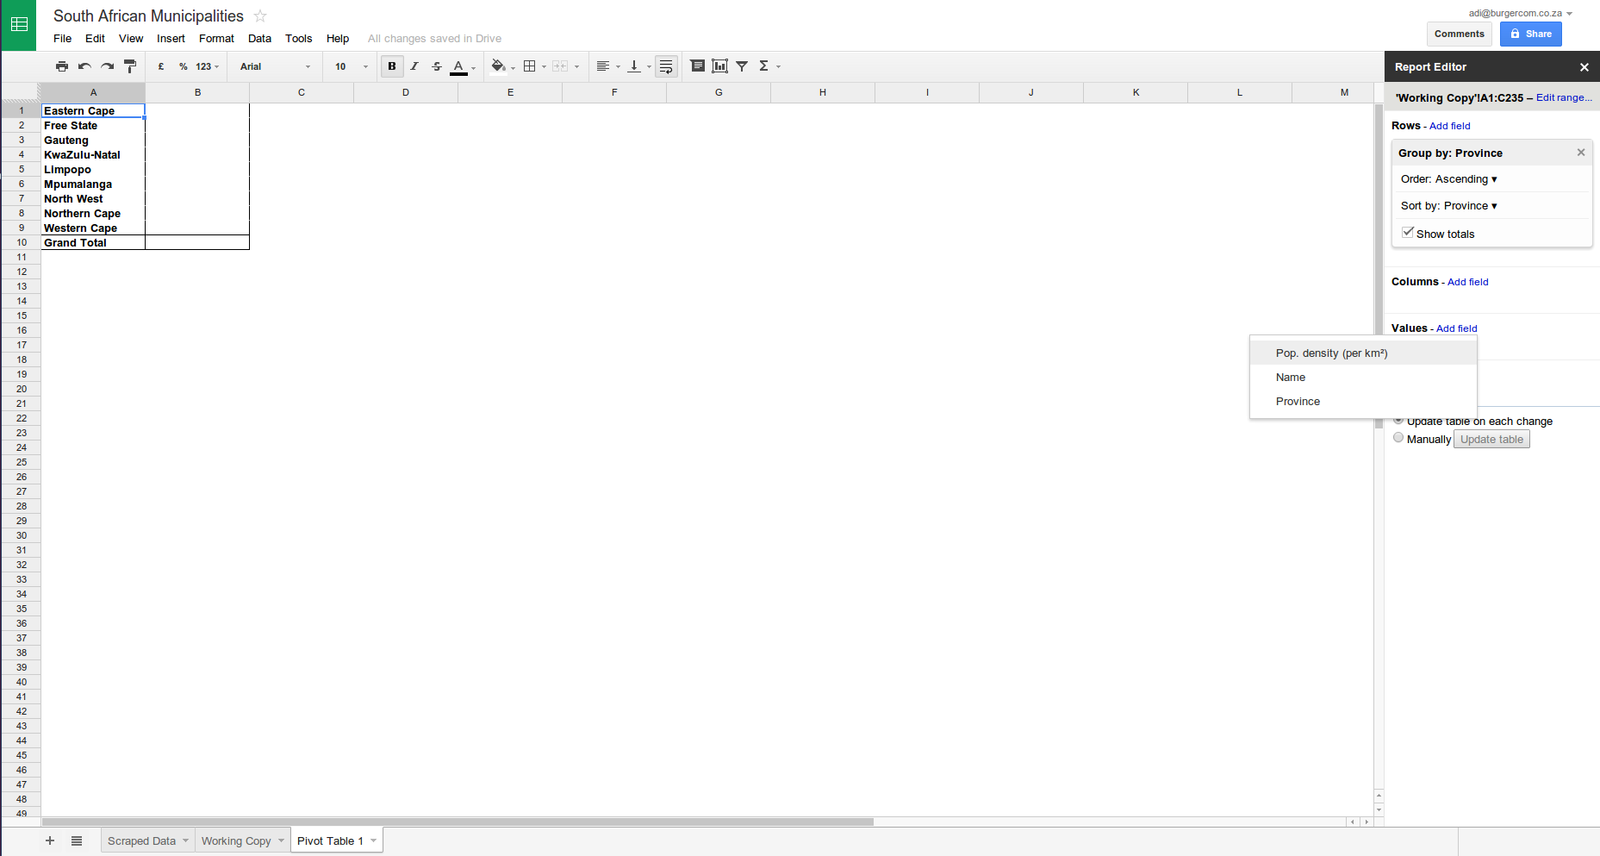
Put the provinces in the rows
Densities for the values
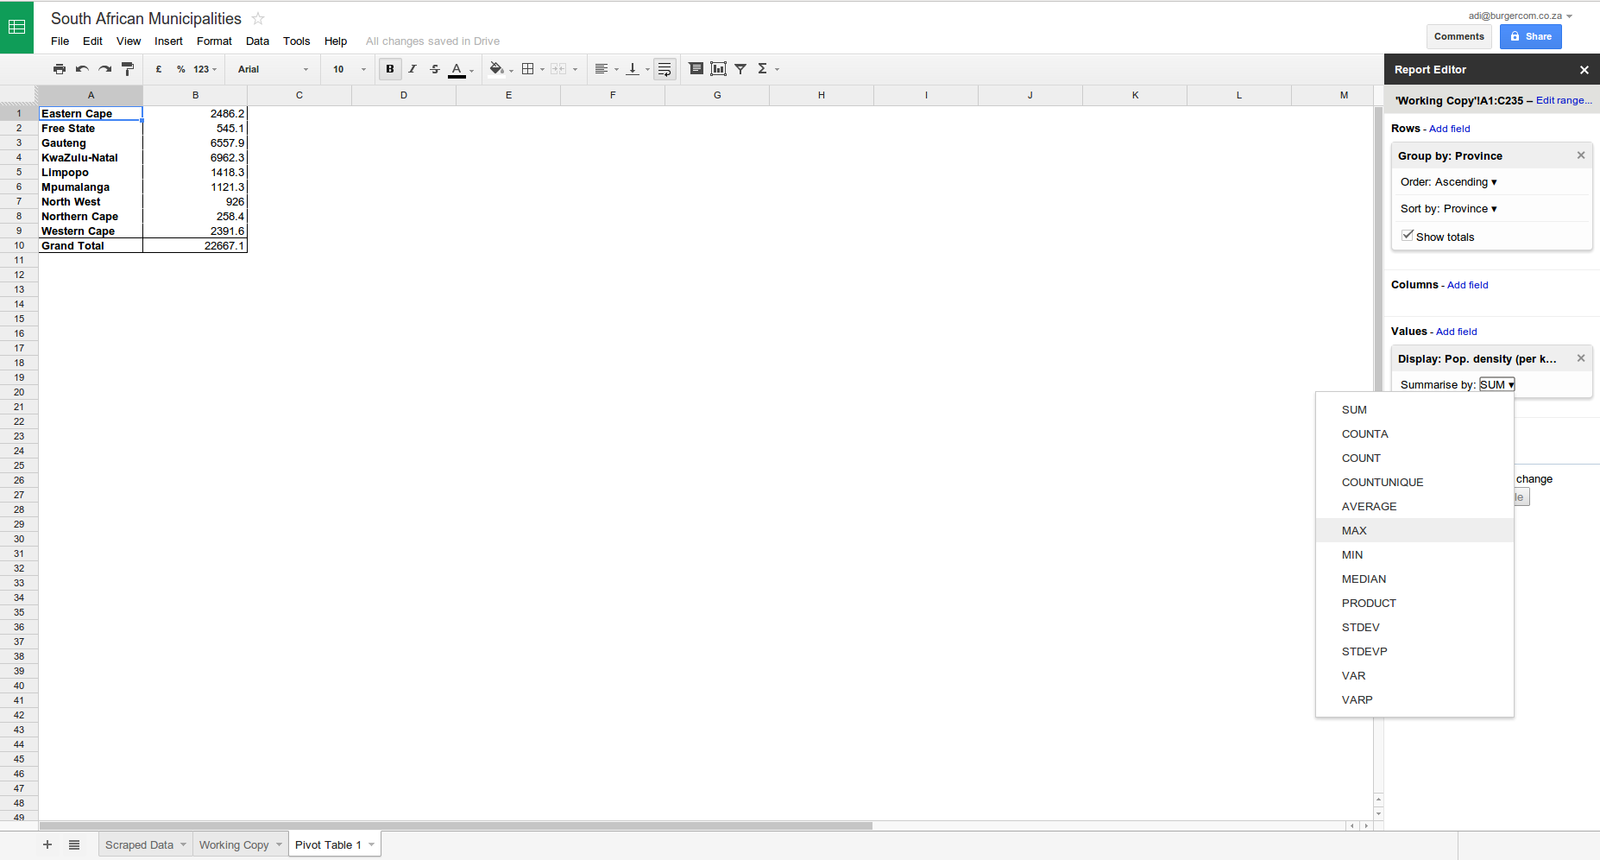
Change from sum to max
i.e. we want the largest density by province
Vlookup - this can be scary
but really, we just want to find out which municipality has a density of 588.1
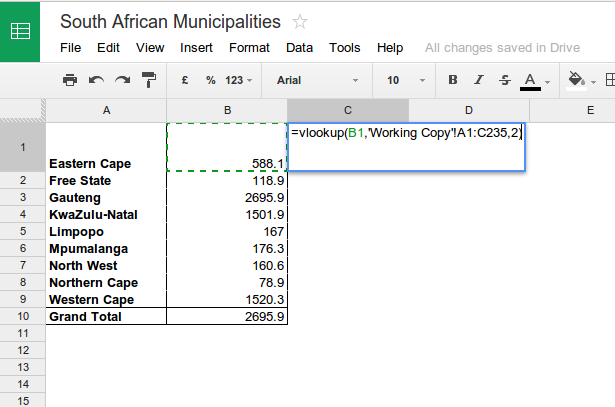
Tada!
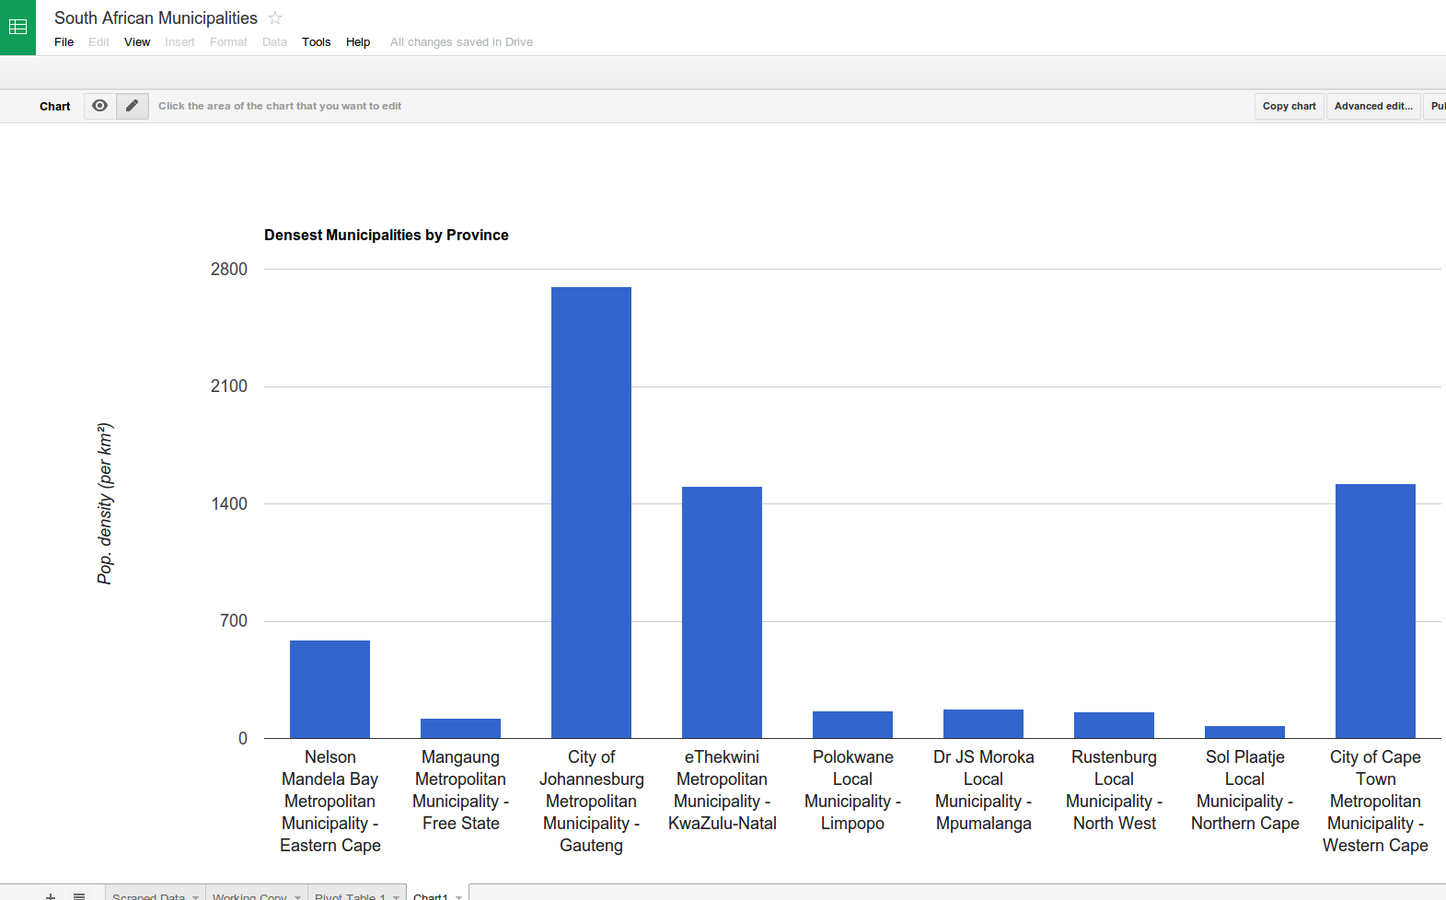
densest municipalities by province
Now let's chart it
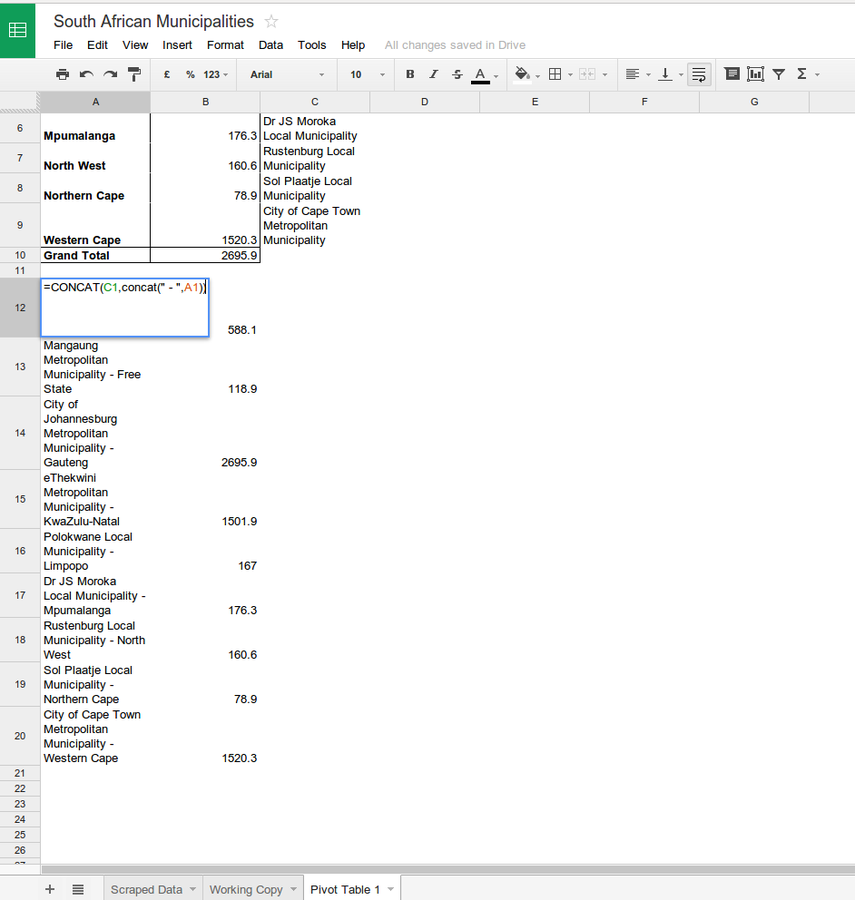
create a copy of the data
we just need re-arrange it a little
Select the data and press chart
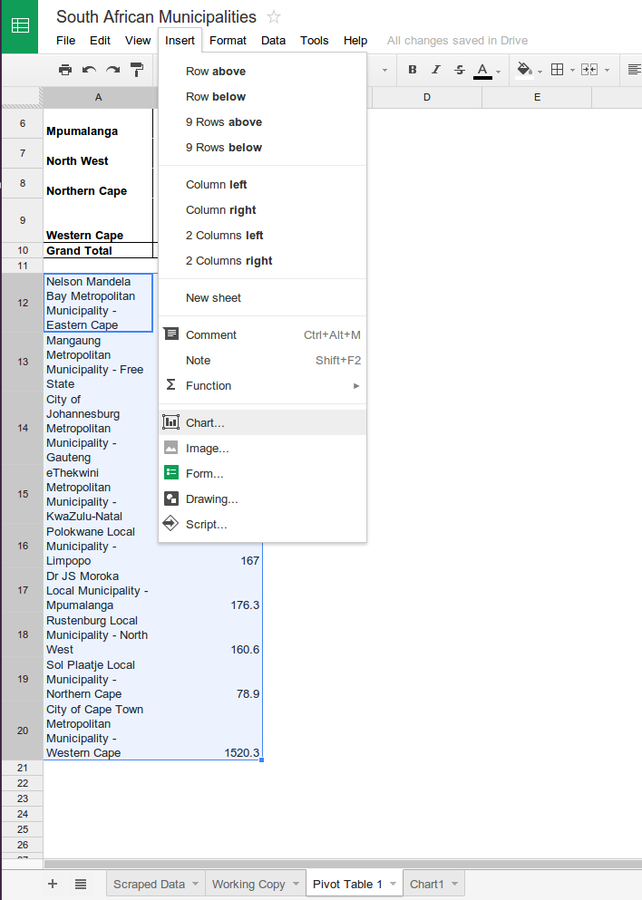
Select a chart type
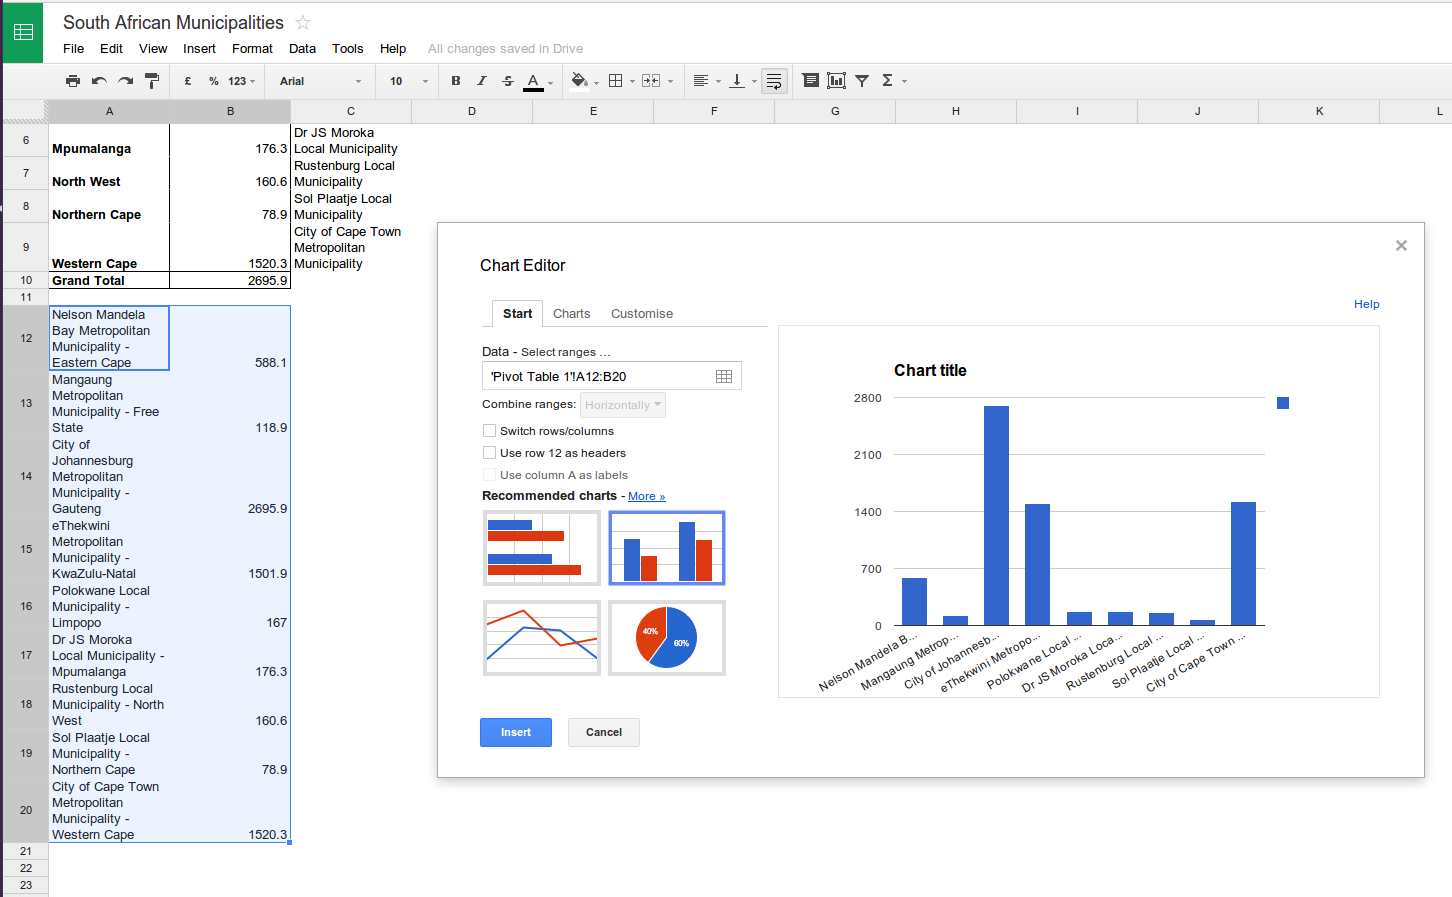
Done
it's safe to breath now
Simple DATA DooDLE
By Adi Eyal


