Columbia Creates:
Introduction to D3.js
October 14, 2014
P V
What does D3.js provide?
Representation
Transformation
So how do D3.js visualizations work?
Construct it on existing standards:
- HTML
- SVG
Benefits of using HTML & SVG
- Already established, familiar standard
- Integrate with existing systems
- Use other tools on it (ex. chrome dev tools)
Goal of D3.js?
Maintain mapping
Data points -> visual elements
Work Canvas
An HTML page
bit.ly/1pFk8l9<!DOCTYPE html><html><head><title>D3.js Demo</title><style> /* CSS goes here */ </style><script src="http://d3js.org/d3.v3.min.js" charset="utf-8"></script></head><body><p>D3.js is awesome!</p><p>This is another paragraph.</p><script> /* JS goes here */ </script></body></html>
Selectors
Take existing elements and modify them
d3.selectAll('p').style('color', 'green');Selectors
They can also take dynamic, functional values
d3.selectAll('p').style('color', function(){
  return 'rgb( 0, '+ Math.floor(Math.random() * 360) + ', 0)';
});
Creating new elements?
Surprise: no primitive function for that in D3.js!
Instead: data joins.
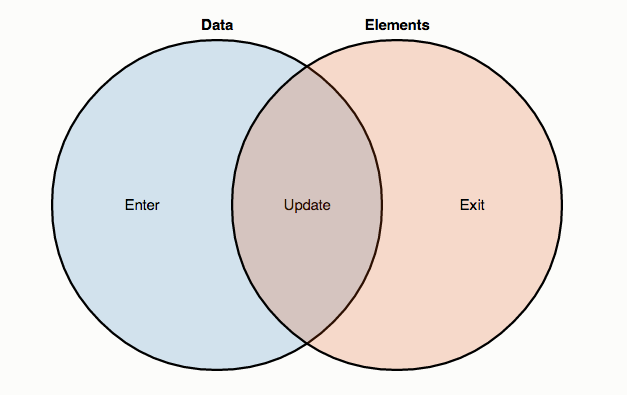
Data Joins
- Select the elements you WANT to work on
- Bind it to the data.
d3.selectAll('p').data([3, 42, 69, 101])Data Joins
3 selections to choose from:
.enter(), .update(), .exit()
Data Joins
var p = d3.selectAll('p')
  .data([3, 42, 69, 101])
  .style('color', 'green');

p.enter()
  .append('p')
  .text(function(d, i) {
    return 'My '+ i + 'th favorite number is '+ d;
  });
Transitions
Transformations -> animated transition
(aka why D3.js looks so cool in action)
Transitions
- Select your elements
- Transition!
d3.selectAll('p')
  .transition()
  .duration(3000)
  .delay( function(d, i) { return i*3000; })
  .style('font-size', '40px');
SVG
Similar in structure to HTML
<svg width="200" height="200"><rect x="50" y="5" width="20" height="40" rx="3" ry="3" /><line x1="5" x2="90" y1="10" y2="90" stroke-width="3" stroke="green" /><g stroke="purple" fill="blue" stroke-width="5" ><circle cx="150" cy="30" r="40" /><circle cx="150" cy="60" r="40" /><circle cx="150" cy="90" r="40" /></g></svg>
Note:
Position & size are SVG attributes
Styles may be defined in CSS
SVG Canvas Creation
To start, create the SVG canvas via D3.js
var w = 500,h = 100;var svg = d3.select('body').append('svg').attr('width', w).attr('height', h);
Let's Actually Make a Visualization
Proposed data set:
Sleep hours per 24-hour intervals over a week
var sleepData = [ 8, 7, 8, 8, 9, 12, 9 ];
Bar chart time!
Let's Actually Make a Visualization
Add to the created SVG canvas as rectangles
svg.selectAll('rect')
  .data(sleepData)
  .enter()
  .append('rect')
  .attr('x', function(d, i) {
    return i * (w / sleepData.length);
  })
  .attr('y', function(d) {
    return h - (d * 9);
  })
  .attr('width', w / sleepData.length - 2)
  .attr('height', function(d) {
    return d * 9;
  });
Columbia Creates: Intro to D3.js
By liviro


