Reporting, Dashboards and Analytics for Big Data and NoSQL
ernesto ongaro - dublin
november 2013
Agenda
- What is Big Data and NoSQL about?
- Explore 3 ways to get at your NoSQL data
- Indirect batch analysis
- Batch analysis
- Interactive exploration
- Example + Demonstration
- Q&A
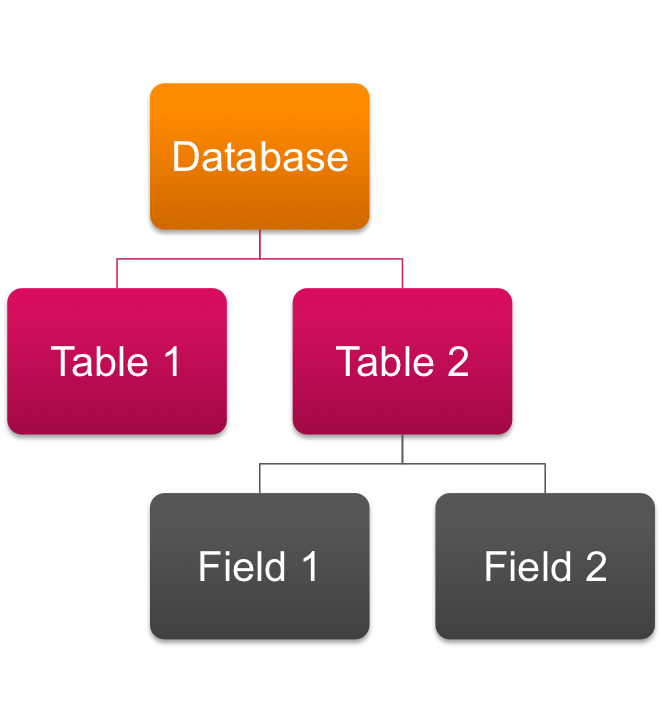
Relational Databases
-
Databases are sets of tables, those tables have fields
- Data is stored in columns and rows, rows have fields of a specific type. Fixed schema
-
Queried through SQL - can restrict, project and join
- Use an RDBMS unless you find limitations with it
Buzz words
NoSQL + BigData usually are synonymous. Not true!
NoSQL: A database that is not relational, data is stored more flexibly than column and rows. Queried through other ways than just SQL
Big Data: Data that is probably bigger than what can comfortably fit into an RDBMS
NoSQL Databases
Store data differently: documents, key value stores, graphs
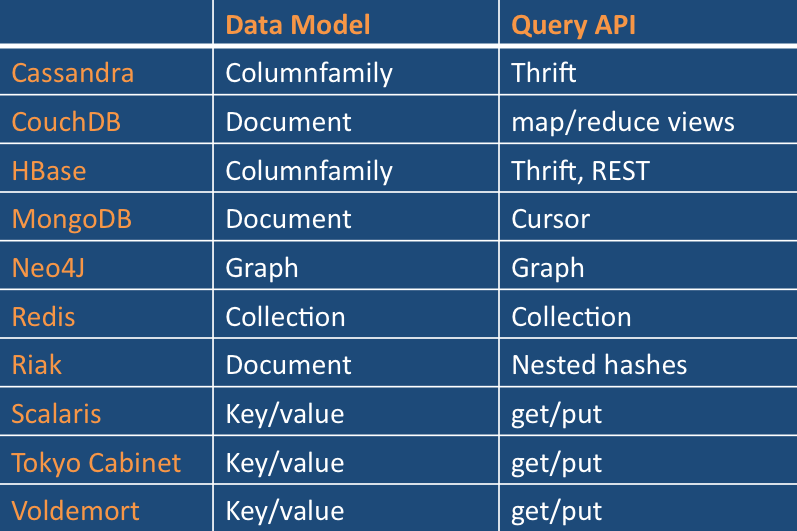
source: rackspace
Document Database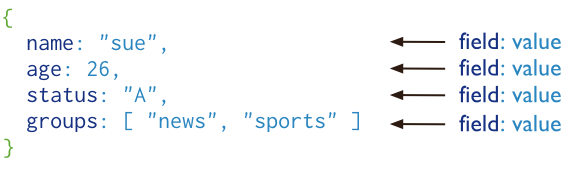
-
Instead of rows/columns you have documents
- Flexible
- Excellent example of NoSQL
- Examples: MongoDB, CouchDB
Graph Stores
Image: Wikipedia Graph Database article
- Specialized storage in nodes, properties and edges
- Node: item, in this case a person
- Properties: Describe a node
- Edges: Relationships between nodes
Key-Value Stores
| Key: 1 | Sex: Female | Score: 199 | Age: 27 |
| Key: 2 | Fruit: Apple | Score: 222 | Age: 19 | Active: false |
-
Data is stored in "bins" - each bin has a name and a value. A key relates to a set of bins
- Good for very fast operations, not ideal for BI
- Examples: Riak, Redis
Column Stores
- Use tables, have no joins, cheap to make wide and leave values blank
-
Don't confuse them with column-oriented databases like Vertica or Infobright
- Tend to be fast for reads
- Examples: Hadoop HBase, Cassandra
Why NoSQL?
- Scaling
- Simpler data model
- Volume (stream i/o)
- No schema
Reporting and Analytics?
-
Reporting is typically about filtering columns and rows and arranging them how you want the data to be displayed
-
Analytics is typically about aggregating the data in those rows and visualizing it in a crosstab or chart
this is true for both NoSQL and SQL data
exceptions: graph and tree visualizations and other specialized visualizations
So....
The labor of reporting and analytics on NoSQL is "flattening" data and fitting it into rows and columns
3 Ways to get at your NoSQL data
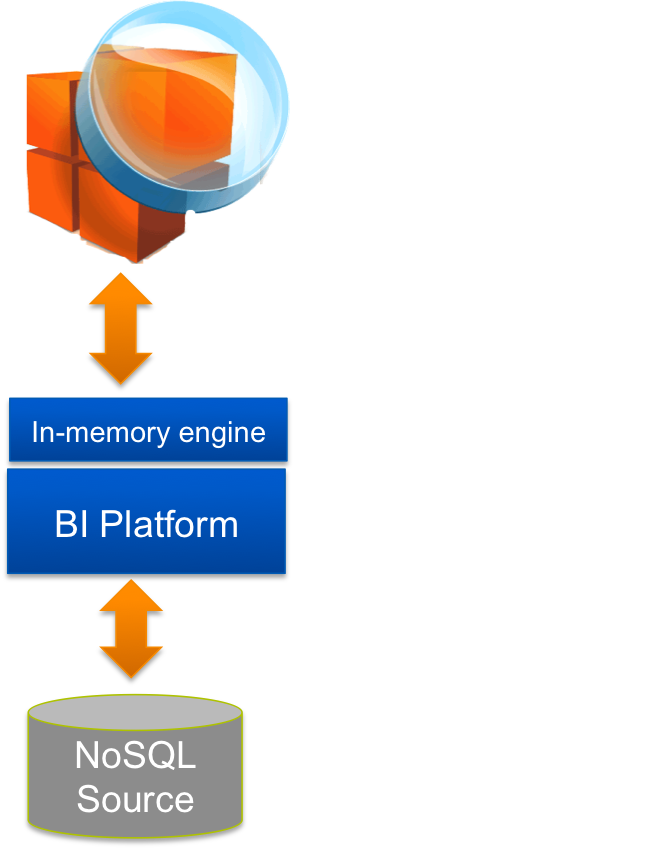
Indirect Batch Analysis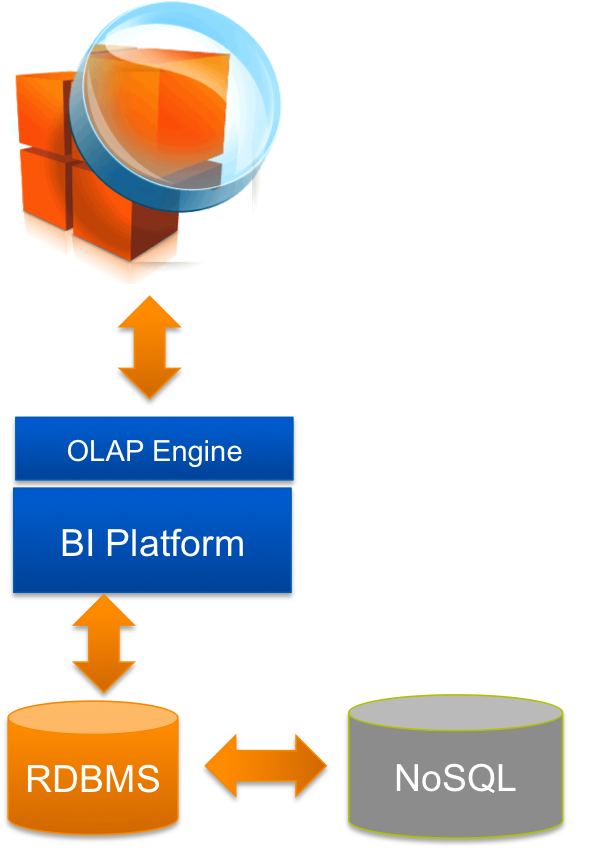
-
Benefits:
- Use your BI tool of choice
- ETL lets you "clean" data
- Down falls:
- Latency and maintenance of ETL process
- Making copy of data
Interactive Data Exploration
- Benefits:
- No latency
- No development of ETL
- Downfalls:
- Data quality issues
- No metadata, queries still written by developers
Direct batch reporting
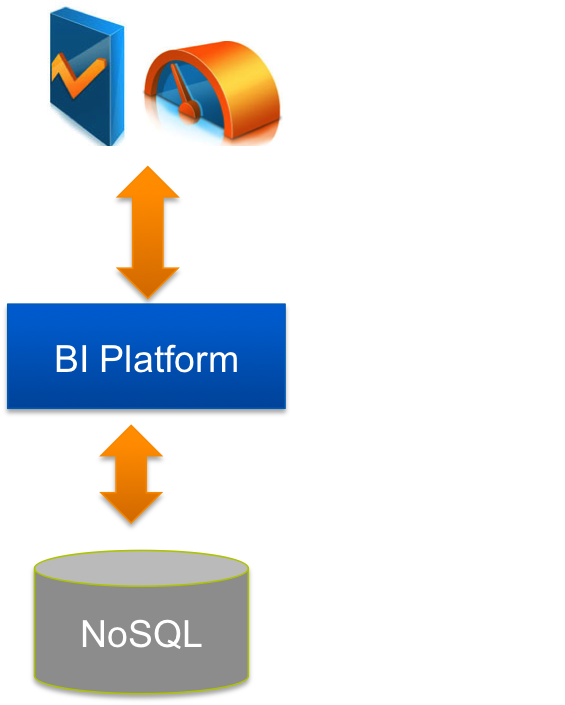
- Benefits:
- Leverage native query language
- Low/No latency
- Downfalls:
- No data quality filter
- Queries on NoSQL can be hard (no joins, etc)
Jaspersoft:
Does all three!
Direct batch and Live exploration connectors for:
MongoDB, Cassandra, Hadoop Hbase, Hadoop Hive
ETL components (from Talend):
- Demo on MongoDB ETL
-
Demo on MongoDB Reporting
- Demo on data MongoDB Exploration
Questions?
Thank you!
@not_a_poet
Reporting and Analytics with NoSQL databases Ernesto Ongaro
By ernestoo


