The collection was developed under the auspices of the former Head Librarian, Ray Anne Lockard, now retiring
There is no formal collection policy
No other staff member has worked closely with developing the collection or has specialized knowledge of artists' books
This project proposes that visualizing the existing collection can help identify its strengths and weaknesses, trends and focal points, to inform future collection development and potential establishment of a collection policy
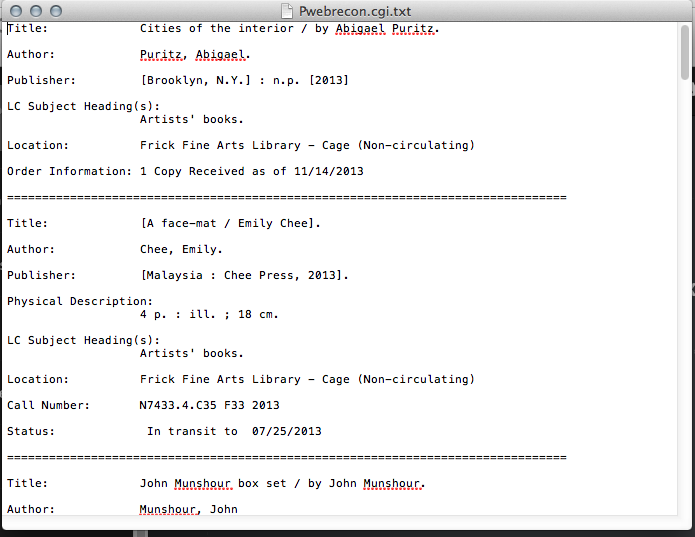
-- The only collection-specific inventory is in a word processing file with bibliographic data and a short description of each work. While of some use, it is incomplete, never updated, and riddled with basic errors
Inconsistent cataloging:
--Artists' books are cataloged by the ULS's English-language cataloger, who has no specialized knowledge or training. Consequently, the cataloging varies widely and not all artists' books can be identified in PittCat by subject heading.
Bottom line:
There is no single place where the entire collection is identified or described as a coherent whole.
Creation of the Data Set
Trial and error!
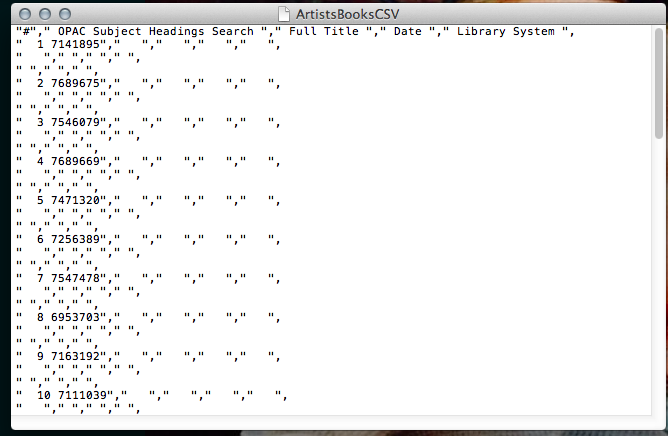
Found no satisfactory way to automate the export of bibliographic data to a spreadsheet from the library's OPAC
First try: Exported data as *.csv from OPAC search result table
Exported only OCLC numbers, not bibliographic display
...not too useful.
Ultimately saved bibliographic data from subject heading searches as *.txt files, then compared to existing inventory
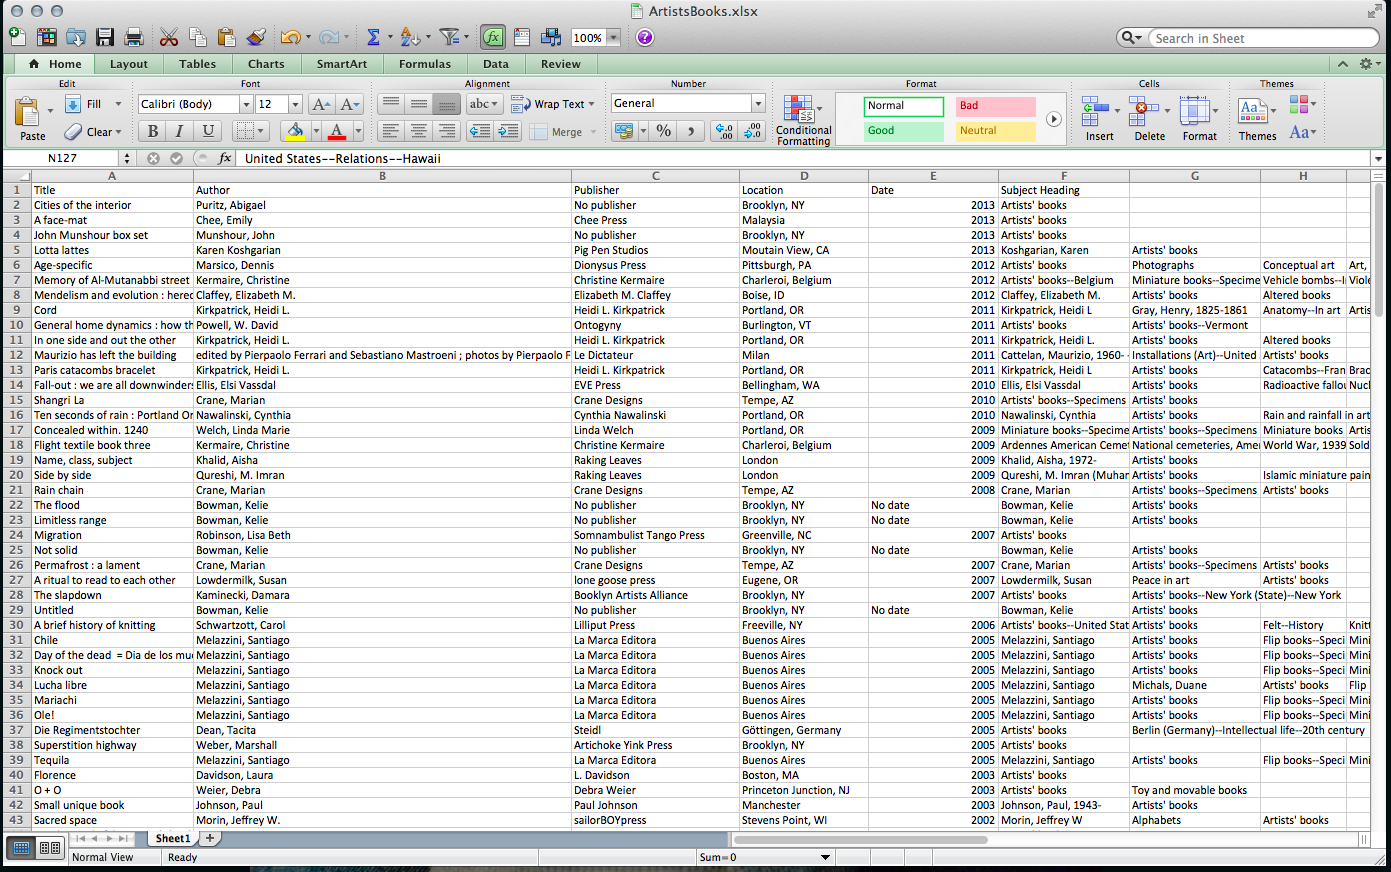
Imported to Excel
Manually reformatted into desired columns
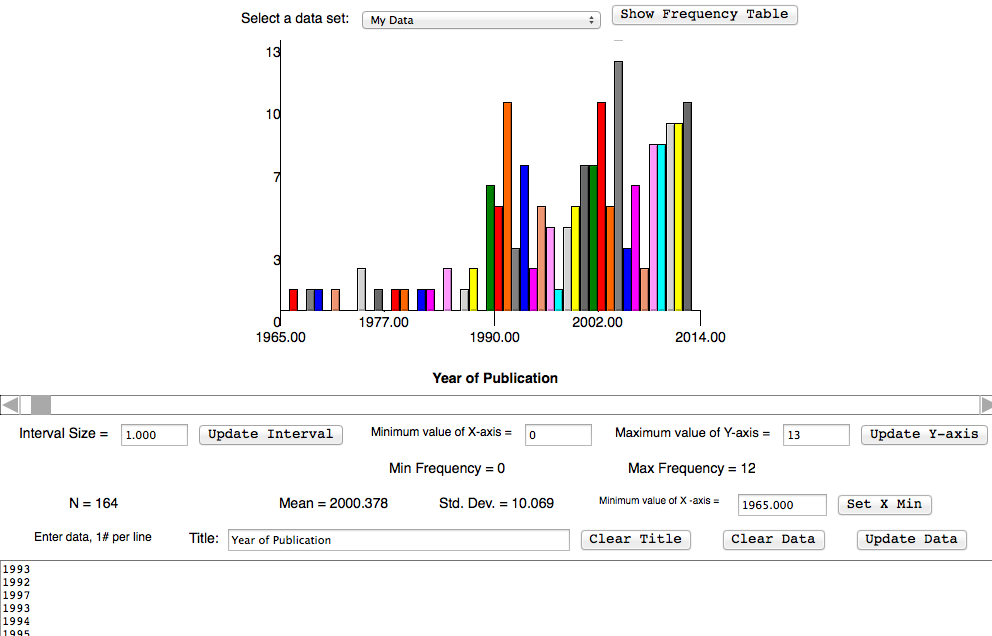
Identified 167 artists' books
May still be incomplete, due to cataloging inconsistencies
Data set includes title, author, publisher, date of publication, place of publication, and up to 9 Library of Congress Subject Headings
Approximately 70 books identified using subject search "Artists' book" + location search "Fine Arts"
Remaining books identified using existing inventory; subject headings were then added by searching the OPAC, revealing that many books were not classified with LCSH "Artists' book", but with geographically specific and other subject headings
Recommendations
As digital tools develop further to add value and meaning to collections, libraries should make bibliographic data more easily exportable to file formats that can be used to visualize and explore (eg *.csv, *.xlsx, *.gexf)
Special collections should engage in cataloging practices that more effectively and consistently "tag" items to be searched as a coherent collection (eg use "Artists' book" as primary subject heading for all collection items before geographically subdividing)
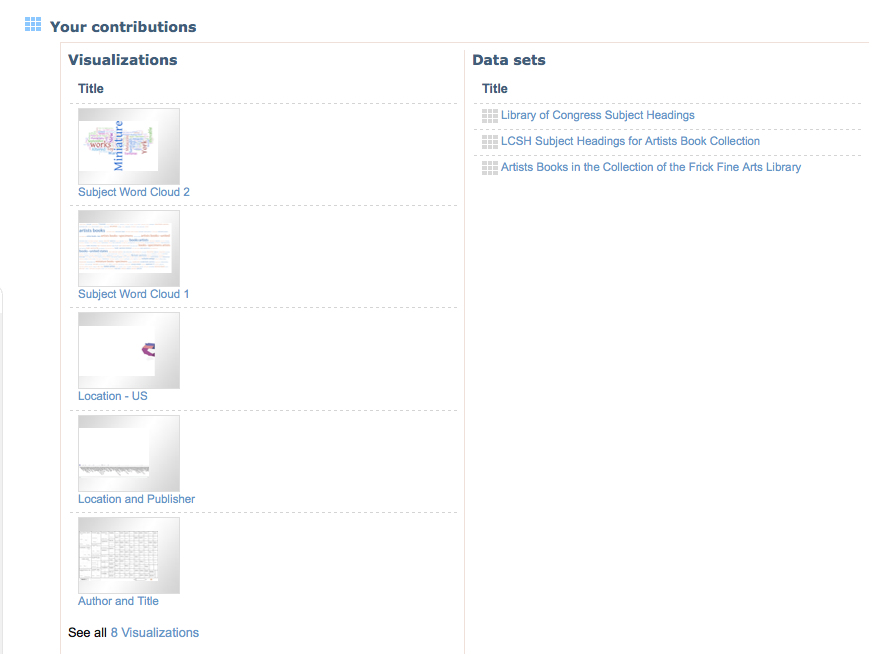
Visualization goals
Identify tools that would reveal hidden relationships and trends within the collection items
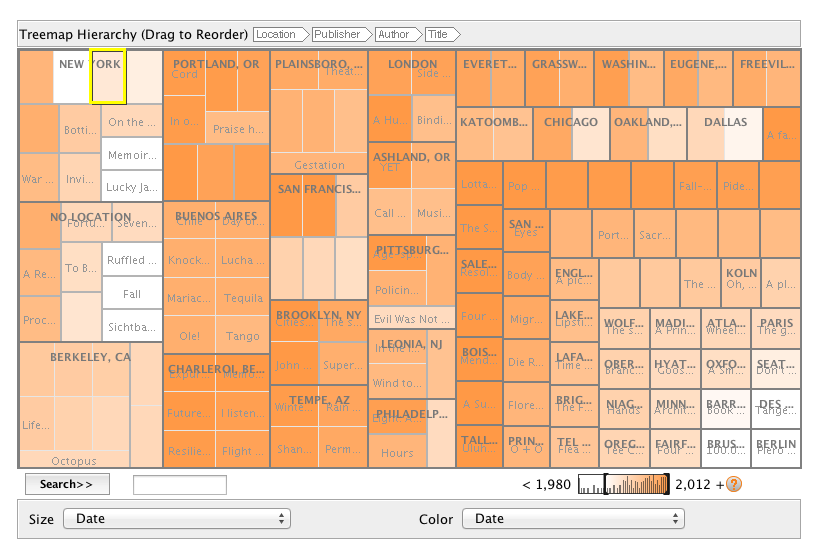
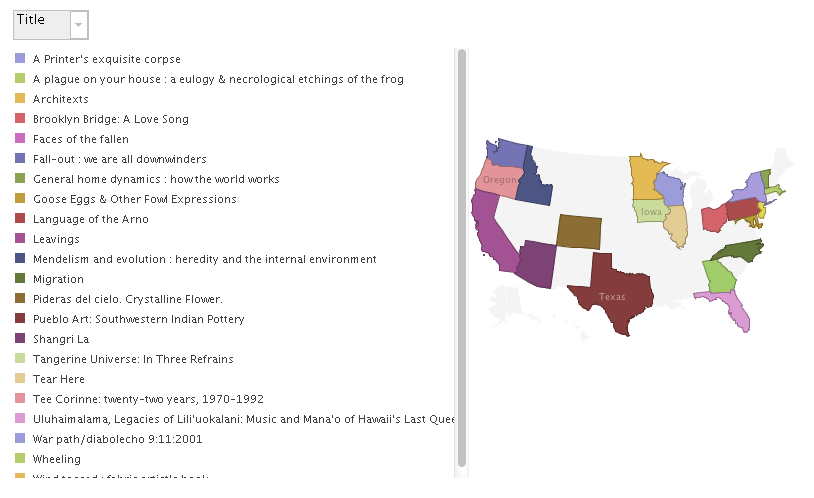
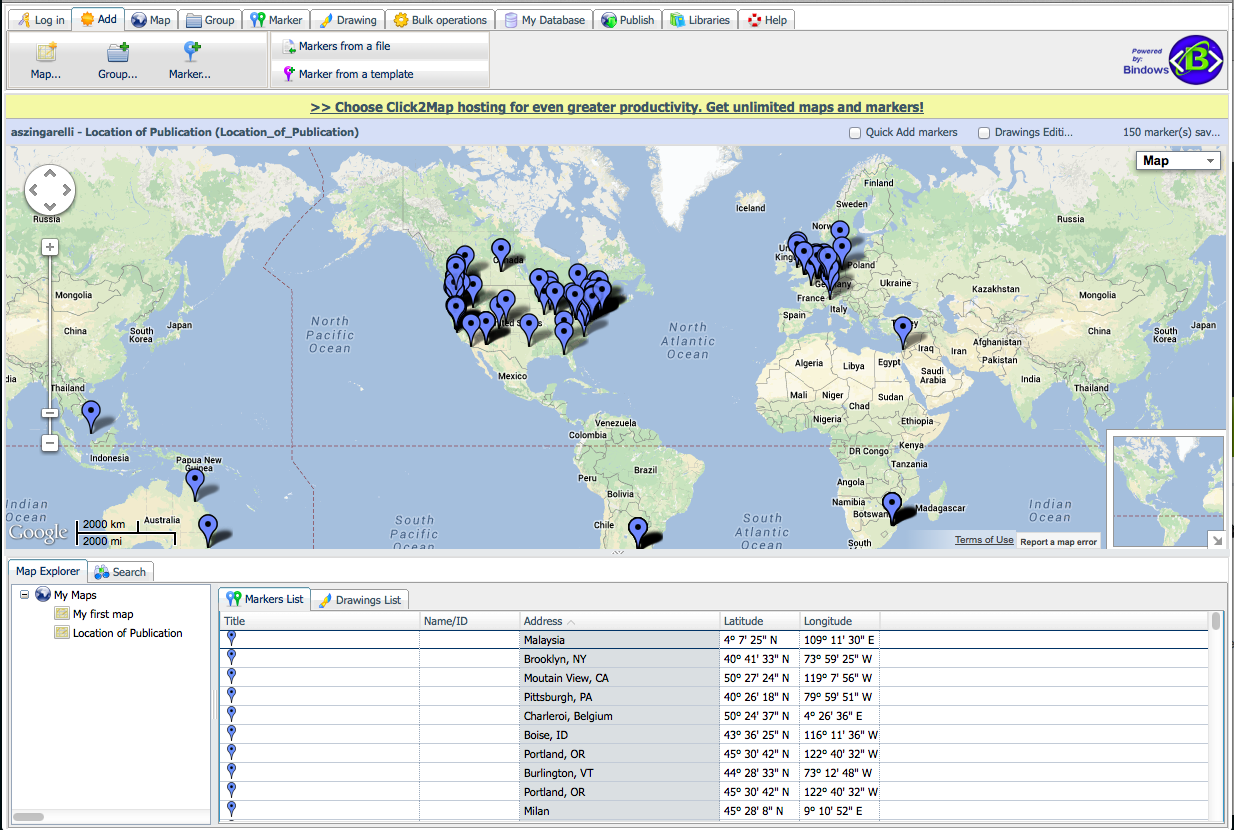
mapping publication locations
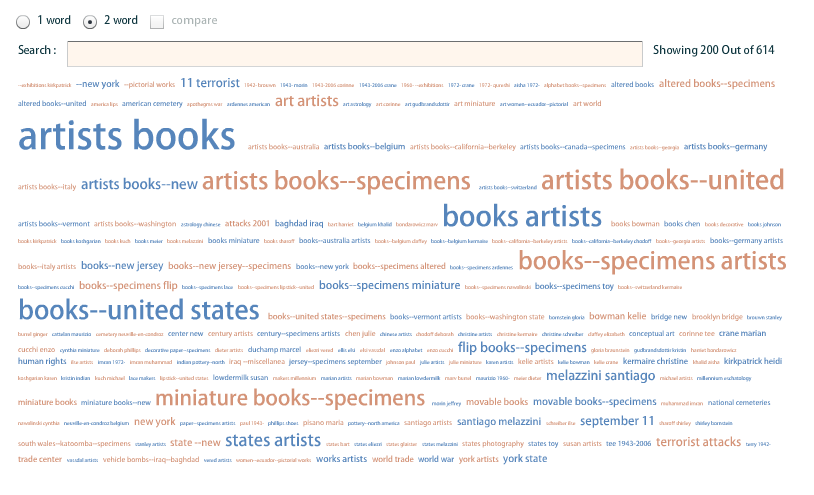
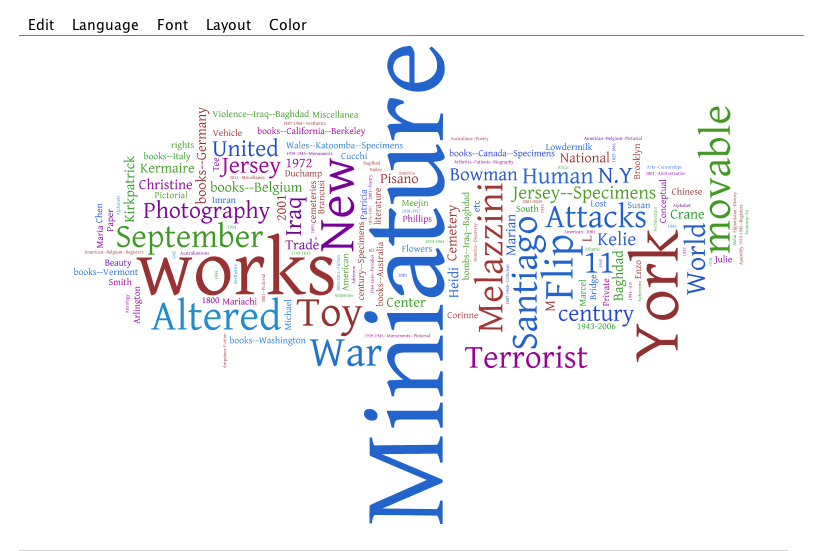
subject/keyword word clouds
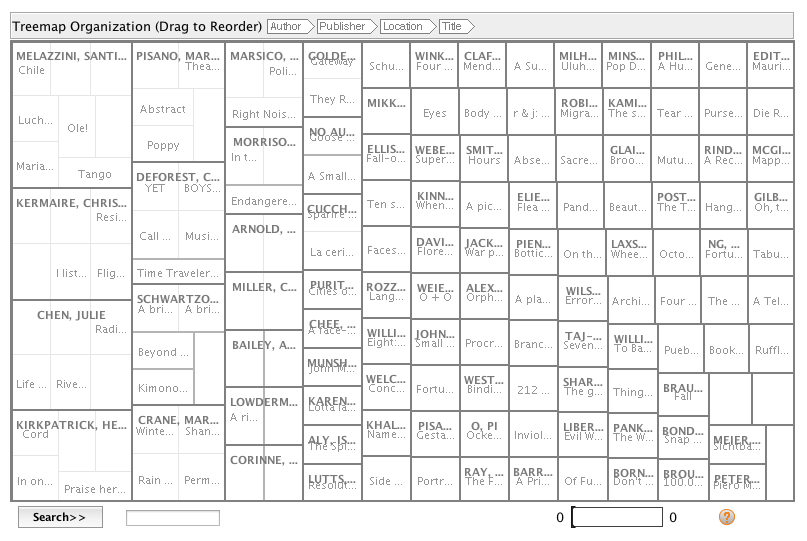
author relationship networks
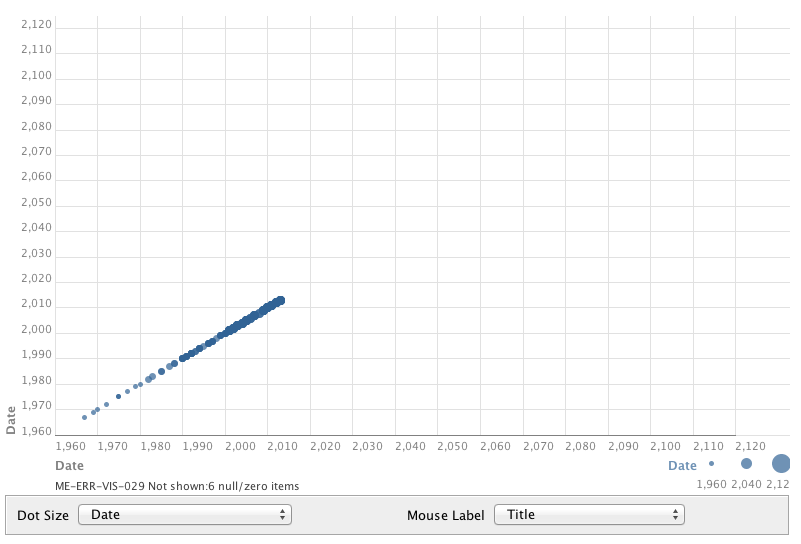
timeline
Seed ideas for a digital exhibition of works from the collection
Secondary goal: to demonstrate value of digital tools for traditional library functions (like collection development) to library leadership
First turned to Gephi due to positive feedback from peers
Downloaded free version 0.8.2-beta
Attempted to upload as *.csv (converted from *.xlsx spreadsheet), but Gephi interpreted each word in the document as a separate node, resulting in thousands of decontextualized nodes
Not apparent how my data could be transformed into other formats supported by Gephi (GDF, GML, GEXF)
May be usable with additional time spent marking up data and watching tutorials, but was not easily accessible for the typical humanities librarian
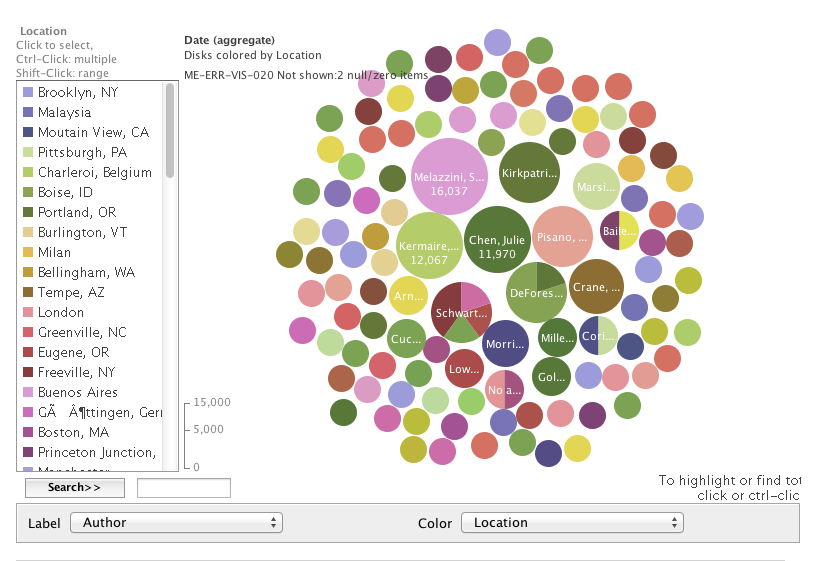
Size of bubble corresponds to number of author's work in collection (sort of...)
Since dates are treated as quantities, the size of the bubble reflects the sum of the dates, rather than the actual number of instances. It still successfully identifies more prominent authors, since those with more items in the collection have larger date sums, but is confusing and over-represents more recent authors
Color of bubble corresponds to publication location. This is suggestive of potential geography-based author networks, and reveals when an author has published in more than one place
Despite proliferation of free online tools, few are accommodating to the types of data and relationships relevant to analyzing library collections and accessible to average humanities librarians
Even these flawed visualizations, however, hint at the possibilities of visualizing this kind of data
Existing tools should be made more flexible to accommodate dates, key phrases, and larger data sets
Possible market for new specialized tools geared towards librarians and library collections
 ...not too useful.